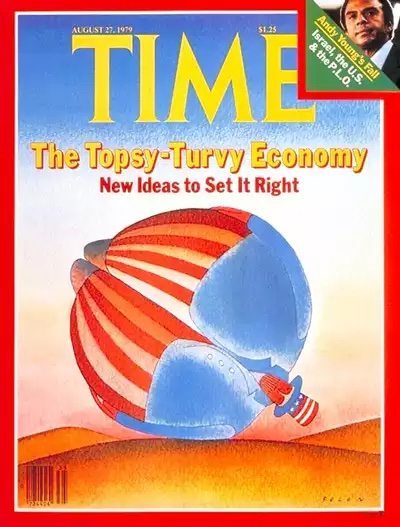
It’s been a topsy-turvy S&P $ year


While many any have been lamenting the decline in revenues and blaming a volatile world a rising US$ or lagging demand, year to date growth has been mixed.

At the half year health care and telecom stocks listed on the S&P 500 were well up on GDP growth. Whilst Energy stocks were down, but unexpectly revenue was down 32%.… Read more
Pimco’s tail risks

Investment company Pacific Investment Management Co., (Pimco) recently gathered a range of major political and economic heavy weights to think through the future.  They popularized the term “new normal” to describe an era of below-average economic growth following the 2007-08 Global financial crisis, says that period is gradually entering a new phase. Economic growth globally will be converging toward lower, yet more stable top speeds and central bank interest rates will remain stuck below their pre-crisis equilibrium in a “new neutral,” outlining the firm’s expectations for the next three to five years.… Read more

Oil Price jitters- is it up or is it down

Oil prices continued their rally this week, after an 8% surge on Friday 30 January.

As some traders try to identify the bottom in oil prices, Morgan Stanley warns that “small crude oil rallies can occur, but are likely limited and unsustainable.”

Data from Baker Hughes last week showed that US oil rigs posted a weekly decline that was the most since the drilling company started collecting the data.… Read more

Why has Copper collapsed…

and who gets hit by the crashing prices?

The crash in copper prices is the latest in a global commodities sell off, which has been highlighted by the decline in the price of oil, which is down more than 50% since June. Copper id down substantially and was don almost 7% in trading on 14 January.

copper chart

Morgan Stanley in Australia attributed the drop in copper prices to “speculation that cheaper energy costs will encourage mining companies to increase production.”  … Read more

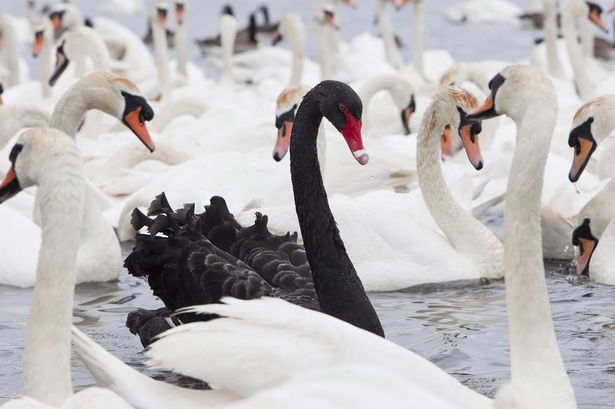
Soc Gen Black Swans – June 2014

Societe Generale is out with its famous quarterly black swan chart.

Black swan events are those that have a low probability of occurring, but also have the potential to roil financial markets if they occur.

With a 30% probability, a Chinese hard landing (four straight quarters of below 5% growth) poses the most significant downside risk, according to SocGen.

They think the likely triggers will be domestic issues.… Read more