
Ever wondered how much time the average person spends looking at their TV, computer, phone or laptop? Well, this chart shows exactly that, broken down by country.
Produced by Mary Meeker for her annual presentation on internet trends, the chart reveals some interesting insights. Clearly Indonesia and the Philippines are glued to their screens- and I think Singapore would be up there too based on what I see each day on the bus- but it’s the breakdown where it get interesting. Look at the disparity in TV viewing between the U.S. and Vietnam, say, despite their similar totals; or the lack of tablet time in South Korea. (But then, maybe that’s because Samsung tablet suck.) And Italy and France barely spend any time at a screen

and while people are on TV, they are increasingly on different screens simultaneously

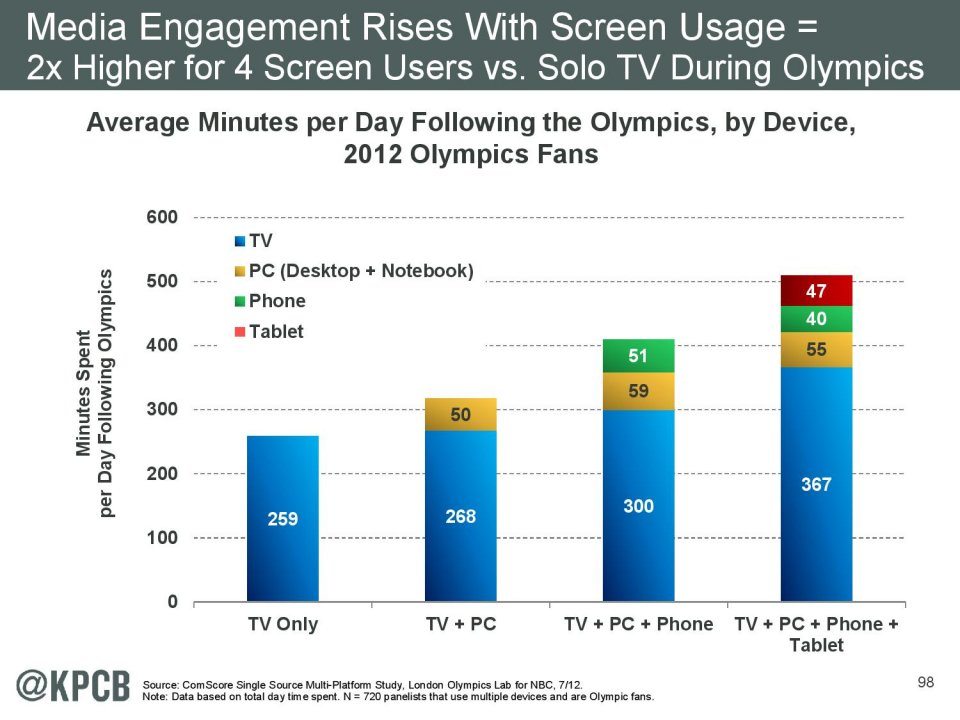
the more devises people tend to use, the engagement with the media also rises
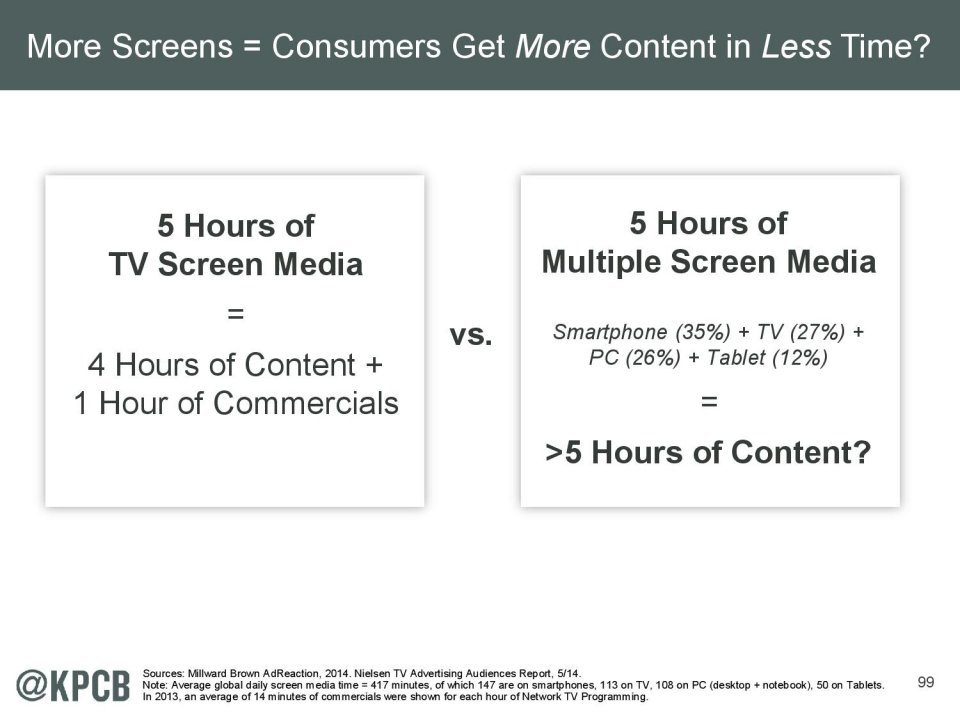
and more screens means more content in LESS time
so does your communication plan start to replicate these media consumption habits? Will it ever?